Tuesday, 2 February 2021

Dynamically Switching From One HTML Element to Another in Vue

A friend once contacted me asking if I had a way to dynamically change one HTML element into another within Vue’s template block. For instance, shifting a <div> element to a <span> element based on some criteria. The trick was to do this without relying on a series of v-if and v-else code.

I didn’t think much of it because I couldn’t see a strong reason to do such a thing; it just doesn’t come up that often. Later that same day, though, he reached out again and told me he learned how to change element types. He excitedly pointed out that Vue has a built-in component that can be used as a dynamic element in the very way that he needed.

This small feature can keep code in the template nice and tidy. It can reduce v-if and v-else glut down to a smaller amount of code that’s easier to understand and maintain. This allows us to use methods or computed methods to create nicely-coded, and yet more elaborate, conditions in the script block. That’s where such things belong: in the script, not the template block.

I had the idea for this article mainly because we use this feature in several places in the design system where I work. Granted it’s not a huge feature and it is barely mentioned in the documentation, at least as far as I can tell. Yet it has potential to help render specific HTML elements in components.

Vue’s built-in <component> element

There are several features available in Vue that allow for easy dynamic changes to the view. One such feature, the built-in <component> element, allows components to be dynamic and switched on demand. In both the Vue 2 and the Vue 3 documentation, there is a small note about using this element with HTML elements; that is the part we shall now explore.

The idea is to leverage this aspect of the <component> element to swap out common HTML elements that are somewhat similar in nature; yet with different functionality, semantics, or visuals. The following basic examples will show the potential of this element to help with keeping Vue components neat and tidy.

Buttons and links are often used interchangeably, but there are big differences in their functionality, semantics, and even visuals. Generally speaking, a button (<button>) is intended for an internal action in the current view tied to JavaScript code. A link (<a>), on the other hand, is intended to point to another resource, either on the host server or an external resource; most often web pages. Single page applications tend to rely more on the button than the link, but there is a need for both.

Links are often styled as buttons visually, much like Bootstrap’s .btn class that creates a button-like appearance. With that in mind, we can easily create a component that switches between the two elements based on a single prop. The component will be a button by default, but if an href prop is applied, it will render as a link.

Here is the <component> in the template:

<component
  :is="element"
  :href="href"
  class="my-button"
>
  <slot />
</component>

This bound is attribute points to a computed method named element and the bound href attribute uses the aptly named href prop. This takes advantage of Vue’s normal behavior that the bound attribute does not appear in the rendered HTML element if the prop has no value. The slot provides the inner content regardless whether the final element is a button or a link.

The computed method is simple in nature:

element () {
  return this.href ? 'a' : 'button';
}

If there’s an href prop,. then an <a> element is applied; otherwise we get a <button>.

<my-button>this is a button</my-button>
<my-button href="https://www.css-tricks.com">this is a link</my-button>

The HTML renders as so:

<button class="my-button">this is a button</button>
<a href="https://www.css-tricks.com" class="my-button">this is a link</a>

In this case, there could be an expectation that these two are similar visually, but for semantic and accessibility needs, they are clearly different. That said, there’s no reason the two outputted elements have to be styled the same. You could either use the element with the selector div.my-button in the style block, or create a dynamic class that will change based on the element.

The overall goal is to simplify things by allowing one component to potentially render as two different HTML elements as needed — without v-if or v-else!

Ordered or unordered list?

A similar idea as the button example above, we can have a component that outputs different list elements. Since an unordered list and an ordered list make use of the same list item (<li>) elements as children, then that’s easy enough; we just swap <ul> and <ol>. Even if we wanted to have an option to have a description list, <dl>, this is easily accomplished since the content is just a slot that can accept <li> elements or <dt>/<dd>combinations.

The template code is much the same as the button example:

<component
  :is="element"
  class="my-list"
>
  <slot>No list items!</slot>
</component>

Note the default content inside the slot element, I’ll get to that in a moment.

There is a prop for the type of list to be used that defaults to <ul>:

props: {
  listType: {
    type: String,
    default: 'ul'
  }
}

Again, there is a computed method named element:

element () {
  if (this.$slots.default) {
    return this.listType;
  } else {
    return 'div';
  }
}

In this case, we are testing if the default slot exists, meaning it has content to render. If it does, then the the list type passed through the listType prop is used. Otherwise, the element becomes a <div> which would show the “No list items!” message inside the slot element. This way, if there are no list items, then the HTML won’t render as a list with one item that says there are no items. That last aspect is up to you, though it is nice to consider the semantics of a list with no apparent valid items. Another thing to consider is the potential confusion of accessibility tools suggesting this is a list with one item that just states there are no items.

Just like the button example above, you could also style each list differently. This could be based on selectors that target the element with the class name, ul.my-list. Another option is to dynamically change the class name based on the chosen element.

This example follows a BEM-like class naming structure:

<component
  :is="element"
  class="my-list"
  :class="`my-list__${element}`"
>
  <slot>No list items!</slot>
</component>

Usage is as simple as the previous button example:

<my-list>
  <li>list item 1</li>
</my-list>

<my-list list-type="ol">
  <li>list item 1</li>
</my-list>

<my-list list-type="dl">
  <dt>Item 1</dt>
  <dd>This is item one.</dd>
</my-list>

<my-list></my-list>

Each instance renders the specified list element. The last one, though, results in a <div> stating no list items because, well, there’s no list to show!

One might wonder why create a component that switches between the different list types when it could just be simple HTML. While there could be benefits to keeping lists contained to a component for styling reasons and maintainability, other reasons could be considered. Take, for instance, if some forms of functionality were being tied to the different list types? Maybe consider a sorting of a <ul> list that switches to a <ol> to show sorting order and then switching back when done?

Now we’re controlling the elements

Even though these two examples are essentially changing the root element component, consider deeper into a component. For instance, a title that might need to change from an <h2> to an <h3> based on some criteria.

If you find yourself having to use ternary solutions to control things beyond a few attributes, I would suggest sticking with the v-if. Having to write more code to handle attributes, classes, and properties just complicates the code more than the v-if. In those cases, the v-if makes for simpler code in the long run and simpler code is easier to read and maintain.

When creating a component and there’s a simple v-if to switch between elements, consider this small aspect of a major Vue feature.

Expanding the idea, a flexible card system

Consider all that we’ve covered so far and put it to use in a flexible card component. This example of a card component allows for three different types of cards to be placed in specific parts of the layout of an article:

  • Hero card: This is expected to be used at the top of the page and draw more attention than other cards.
  • Call to action card: This is used as a line of user actions before or within the article.
  • Info card: This is intended for pull quotes.

Consider each of these as following a design system and the component controls the HTML for semantics and styling.

In the example above, you can see the hero card at the top, a line of call-to-action cards next, and then — scrolling down a bit — you’ll see the info card off to the right side.

Here is the template code for the card component:

<component :is="elements('root')" :class="'custom-card custom-card__' + type" @click="rootClickHandler">
  <header class="custom-card__header" :style="bg">
    <component :is="elements('header')" class="custom-card__header-content">
      <slot name="header"></slot>
    </component>
  </header>
  <div class="custom-card__content">
    <slot name="content"></slot>
  </div>
  <footer class="custom-card__footer">
    <component :is="elements('footer')" class="custom-card__footer-content" @click="footerClickHandler">
      <slot name="footer"></slot>
    </component>
  </footer>
</component>

There are three of the “component” elements in the card. Each represents a specific element inside the card, but will be changed based on what kind of card it is. Each component calls the elements() method with a parameter identifying which section of the card is making the call.

The elements() method is:

elements(which) {
  const tags = {
    hero: { root: 'section', header: 'h1', footer: 'date' },
    cta: { root: 'section', header: 'h2', footer: 'div' },
    info: { root: 'aside', header: 'h3', footer: 'small' }
  }
  return tags[this.type][which];
}

There are probably several ways of handing this, but you’ll have to go in the direction that works with your component’s requirements. In this case, there is an object that keeps track of HTML element tags for each section in each card type. Then the method returns the needed HTML element based on the current card type and the parameter passed in.

For the styles, I inserted a class on the root element of the card based on the type of card it is. That makes it easy enough to create the CSS for each type of card based on the requirements. You could also create the CSS based on the HTML elements themselves, but I tend to prefer classes. Future changes to the card component could change the HTML structure and less likely to make changes to the logic creating the class.

The card also supports a background image on the header for the hero card. This is done with a simple computed placed on the header element: bg. This is the computed:

bg() {
  return this.background ? `background-image: url(${this.background})` : null;
}

If an image URL is provided in the background prop, then the computed returns a string for an inline style that applies the image as a background image. A rather simple solution that could easily be made more robust. For instance, it could have support for custom colors, gradients, or default colors in case of no image provided. There’s a large number of possibilities that his example doesn’t approach because each card type could potentially have their own optional props for developers to leverage.

Here’s the hero card from this demo:

<custom-card type="hero" background="https://picsum.photos/id/237/800/200">
  <template v-slot:header>Article Title</template>
  <template v-slot:content>Lorem ipsum...</template>
  <template v-slot:footer>January 1, 2011</template>
</custom-card>

You’ll see that each section of the card has its own slot for content. And, to keep things simple, text is the only thing expected in the slots. The card component handles the needed HTML element based solely on the card type. Having the component just expect text makes using the component rather simplistic in nature. It replaces the need for decisions over HTML structure to be made and in turn the card is simply implemented.

For comparison, here are the other two types being used in the demo:

<custom-card type="cta">
  <template v-slot:header>CTA Title One</template>
  <template v-slot:content>Lorem ipsum dolor sit amet, consectetur adipiscing elit.</template>
  <template v-slot:footer>footer</template>
</custom-card>

<custom-card type="info">
  <template v-slot:header>Here's a Quote</template>
  <template v-slot:content>“Maecenas ... quis.”</template>
  <template v-slot:footer>who said it</template>
</custom-card>

Again, notice that each slot only expects text as each card type generates its own HTML elements as defined by the elements() method. If it’s deemed in the future that a different HTML element should be used, it’s a simple matter of updating the component. Building in features for accessibility is another potential future update. Even interaction features can be expanded, based on card types.

The power is in the component that’s in the component

The oddly named <component> element in Vue components was intended for one thing but, as often happens, it has a small side effect that makes it rather useful in other ways. The <component> element was intended to dynamically switch Vue components inside another component on demand. A basic idea of this could be a tab system to switch between components acting as pages; which is actually demonstrated in the Vue documentation. Yet it supports doing the same thing with HTML elements.

This is an example of a new technique shared by a friend that has become s surprisingly useful tool in the belt of Vue features that I’ve used. I hope that this article carries forward the ideas and information about this small feature for you to explore how you might leverage this in your own Vue projects.


The post Dynamically Switching From One HTML Element to Another in Vue appeared first on CSS-Tricks.

You can support CSS-Tricks by being an MVP Supporter.


from CSS-Tricks https://ift.tt/3th4eGm
via IFTTT

Announcing the New Technical SEO Certification Series: What It Is & How to Get Certified

Posted by KaviKardos

SEO education has been central to Moz’s mission since the start. In addition to our many guides, blog posts, and videos, we’ve shifted in recent years to offer on-demand video training courses through Moz Academy. Our team has been blown away by the reception of our online training programs. To date, over 142,000 students have enrolled in a course through Moz Academy. Wowie!

On top of that, 94% of Moz Academy students said they would recommend the course(s) they took to a friend or colleague. We’re so glad that our content is resonating with you and helping to level up your knowledge in various SEO subject areas.

We launched our SEO Essentials Certification Series back in May 2019, and we’ve seen almost 500 students get certified in that timeframe. Since then, we’ve heard requests from across the Moz community for more technical-focused coursework and more advanced course options. As a result, we’re stoked to be adding another outstanding certification to our collection of coursework.

The Learning Team has put in many, many hours of work to develop a technically focused, in-depth training series that hones in on the nuts and bolts of technical SEO. We’re thrilled to announce the launch of the Technical SEO Certification Series through Moz Academy.

I want to get started!

What’s included in the Technical SEO Certification Series?

The Technical SEO Certification is a five-part series dedicated to technical SEO, combining video lessons with tasks and activities to allow for practical application of important concepts. The series culminates in a final exam, and with a passing score, you’ll be awarded an official Moz Certificate and badge for your LinkedIn profile.

The Certification Series was built to help you efficiently grow your technical skills and think critically about websites and SEO strategy from an informed technical perspective. By the time you wrap up the series, you’ll be ready to build a technical strategy for your website that ensures crawlability, indexability, accessibility, and site performance.

The certification series focuses on four core competency areas:

  1. Explore the Fundamentals of Technical SEO
  2. Design for Crawlability
  3. Build for Indexation
  4. Prioritize Accessibility & Site Performance

Dig into what’s included in the coursework below:

1. Explore the Fundamentals of Technical SEO

In building a certification series solely focused on technical SEO, we knew laying the groundwork would be critical. Although many folks in the SEO space are aware of various components of technical SEO, we felt it was important to identify where these tactics fit within a larger strategy.

The Explore the Fundamentals course analyzes the reasoning behind technical SEO and its foundational impact on other SEO work. In addition to defining core terminology and principles, you’ll gain a clear understanding of how technical SEO fits into the larger SEO methodology. You’ll learn how search engines find and analyze websites, readying you to apply that knowledge to the concepts of crawling, indexing, accessibility, and site performance that we’ll dive into in later sections.

2. Design for Crawlability

Once we’ve gotten the fundamentals down pat, the Certification Series jumps into crawlability – search engines’ ability to discover and navigate a website. In developing this section of the coursework, we wanted to be sure to provide a thorough background on how search engines operate, what they value, and a step-by-step process to ensure that your website is crawler-friendly.

You’ll learn the importance of optimizing your crawl budget to help crawlers get to the parts of your site that matter most. These considerations can also improve overall SEO health and even site conversions. In addition, we’ll cover robots.txt, site architecture, response codes, log file analysis, and more, using a variety of tools to give you hands-on practice with designing for crawlability.

By the end of this section, you’ll be well-versed in how to optimize for efficient crawling and how to implement and scale fixes across your website.

3. Build for Indexation

Up next in our Certification Series is indexation – how search engines understand, store, and organize information while crawling the web. We want to be sure that you’re confident in your ability to build and present a website that will be indexed properly by the search engines. You’ll next learn how to utilize sitemaps, canonicalization, and structured data to support indexation.

We’ll dig into what search engines typically value as they organize the information they’ve ingested, and how you can use that knowledge to implement tactics that will get your most important content indexed. This will ensure that your valuable content makes its way into the SERPs and, ultimately, to your target audience.

4. Prioritize Accessibility & Site Performance

There are heaps of articles across the web addressing accessibility, and we wanted to build a comprehensive section of the Certification Series dedicated to this vital concern as well as site performance. Here, we dig into top priorities to ensure a site is accessible to all users and performing at its best, as well as tasks to help you do so.

You’ll learn how to conduct an accessibility audit to identify and prioritize optimization efforts. You’ll also discover how components such as URL structure, site speed, mobile-friendliness, and site security impact performance. We’ll look at various tools to help us test these, so that you can create a repeatable process for auditing in the future.

By the end of this class, you’ll be familiar with strategies you can implement to ensure a great (and accessible!) user experience.


Following the courses on these four core competency areas, you will take a final exam to test your knowledge. The exam will consist of 50 multiple-choice questions.

Technical SEO Certification Series FAQs

How do I get certified?

The Technical SEO Certification Series is available through Moz Academy. Just select the series from the catalog, move through the registration process, and get started! After completing the series and taking the final exam, you’ll be awarded an official Moz Certificate and a LinkedIn badge.

Who is this Certification Series best for?

This series is ideal for intermediate SEOs and digital marketers with existing SEO knowledge who are looking to level up their technical skills. The series content covers technical topics that pair nicely with a solid understanding of keyword research, on-page SEO, link building, and content marketing. If you already have familiarity with the SEO fundamentals and are looking to grow your technical expertise, this series is great for you.

If you’re new to SEO and looking to learn the ropes, we’d recommend the SEO Essentials Certification.

How long will the series take to complete?

The certification series includes three hours of instructor-led curriculum, in addition to activities to test your understanding and the final exam. With all of that in mind, you can expect your time commitment to be about five hours in total.

How long is the Technical SEO Certification valid? Do my certification credentials expire?

No, your Technical SEO Certification credentials will not expire.

I don't have a Moz Pro subscription – is the Technical SEO Certification Series still relevant for me?

Yes! While we do use Moz Pro to apply certain concepts throughout the series, having a Moz Pro subscription is not a requirement to benefit from this certification. We’ll also explore a number of technical tasks in other tools outside of Moz. In general, the concepts, activities, and theories covered in the series are agnostic of tools.

Sign me up!

Any other questions or thoughts about the Technical SEO Certification Series? Drop them in the comments below – we’d love to chat with you!


Sign up for The Moz Top 10, a semimonthly mailer updating you on the top ten hottest pieces of SEO news, tips, and rad links uncovered by the Moz team. Think of it as your exclusive digest of stuff you don't have time to hunt down but want to read!


from The Moz Blog https://ift.tt/3ctQrGx
via IFTTT

Monday, 1 February 2021

“Cancelable” Smooth Scrolling

Here’s the situation: Your site offers a “scroll back to top” button, and you’ve implemented smooth scrolling. As the page scrolls back to the top, users see something that catches their eye and they want to stop the scrolling, so they do a smidge of a scroll on the mouse wheel,, trackpad, or whatever. That’s what I mean by cancellable. Without any further action, the scroll event goes to the destination. Cancellable means you can stop it with a subsequent scroll. I find the cancellable behavior better UX, although I have no data to back that up.

I’m finding some discrepancies between browsers, as well as between CSS and JavaScript on how this all works.

Scroll down on this demo and give it a shot:

Here’s what I experienced on the browsers I have easy access to:

CSS Smooth Scroll JavaScript Smooth Scroll
Chrome Cancellable (Speed: Slowish) Not Cancellable
Firefox Cancellable (Speed: Very Fast!) Cancellable (Speed: Fast!)
Safari No Smooth Scrolling No Smooth Scrolling
Edge Cancellable (Speed: Fast) Not Cancellable
iOS No Smooth Scrolling No Smooth Scrolling

If it was up to me, I’d:

  • make smooth scroll actions triggered either through CSS or JavaScript cancellable.
  • define “cancellable” because it isn’t really the right word. Maybe “interrupted”? Or “controlled”? Ideas welcome!
  • make the speed controllable, or if not, attempt to get browsers to agree on a medium-ish speed (that stays consistent regardless of scroll distance).
  • make Safari have it. Smooth scrolling makes things like carousels without JavaScript very practical, and that’s great, particularly on mobile where iOS Safari is forced on Apple devices.

The post “Cancelable” Smooth Scrolling appeared first on CSS-Tricks.

You can support CSS-Tricks by being an MVP Supporter.


from CSS-Tricks https://ift.tt/3cJGxkn
via IFTTT

Open Web Docs

Robert Nyman:

Open Web Docs was created to ensure the long-term health of web platform documentation on de facto standard resources like MDN Web Docs, independently of any single vendor or organization. Through full-time staff, community management, and our network of partner organizations, we enable these resources to better maintain and sustain documentation of core web platform technologies. Rather than create new documentation sites, Open Web Docs is committed to improving existing platforms through our contributions. 

Well that’s… awesome. I know a lot of people were worried about the long-term health of MDN after the Mozilla layoffs, even though they have made some strong moves.

But wait, hasn’t this been tried before with Web Platform Docs? There is a big difference:

Q: Is this the same as Web Platform Docs was?

A: No, Web Platform Docs was a new documentation platform, whereas this is aimed at contributing to existing platforms.

Working through my mental checklist of things I would think this needs to succeed… does it have leadership? Does it have a plan? ✅

Florian Scholz joined the project in November 2020 as our Content Lead, working with stakeholders to define initial workstreams. Our 2021 priorities include working with Mozilla’s MDN writers and engineers to support the recent infrastructure transition and to prioritize and move forward with key documentation work, developing a community of contributors around core web technology documentation, browser compatibility data, and improving JavaScript documentation.

Does it have a team? ✅ Looks like 11 already and new hiring is happening.

Does it have money? ✅

That’s a good chunk of change, but it’s looks like it’s shy of their estimated annual budget of $590k. I bet they’ll hit it the first year, and here’s hoping the big contributors keep that contribution up annually. But even if they don’t, I imagine a ton of good will come from just one year of this much focus and investment.

Direct Link to Article — Permalink


The post Open Web Docs appeared first on CSS-Tricks.

You can support CSS-Tricks by being an MVP Supporter.


from CSS-Tricks https://ift.tt/3sVrCJm
via IFTTT

Figma Crash Course

Totally free course from Pablo Stanley. Can’t beat that.

Figma is just blowing up, and for good reason. It’s good software aligned with what digital designers need. It’s fast. It’s on the web, so you can’t lose stuff and don’t need to figure out a storage strategy. It’s useful beyond designers directly, as the feedback mechanisms are nice and sharing is so easy. The collaborative team features are straightforward and what people expect out of software today. Godspeed.

I also love how it incorporates newfangled web tech so well. I just used the Remove BG plugin in Figma the other day and was like: nice.

Direct Link to Article — Permalink


The post Figma Crash Course appeared first on CSS-Tricks.

You can support CSS-Tricks by being an MVP Supporter.


from CSS-Tricks https://ift.tt/3oGrB9n
via IFTTT

No-Jank CSS Stripes

My mind goes immediately to repeating-linear-gradient and hard-stop gradients when thinking of creating stripes in CSS. You make one stripe by using the same color between two color stops, and another stripe (or more) but using a different color between two colors stops (sharing the one in the middle).

So like:

background: repeating-linear-gradient(
  45deg,
  black,
  black 10px,
  #444 10px,
  #444 11px
);

That will make angled dark gray stripes 10px apart on black.

But this is how it renders on my screen:

Can you see that rendering jankiness where one or two of the stripes seems lighter and thinner than the others? I have no idea why. I assume it’s something to do with sub-pixel rendering or the like. This is not hard to replicate. It’s not just these two colors or this particular angle is just about any stripes created at all with repeating-linear-gradient. It stops being so noticeable with thicker stripes though (say, 5px and thicker).

I made a handful of examples. This one with tighter stripes going the other way is especially prevelant:

I needed to do this the other day, found the jankiness, and remembered this little note in our stripes article. It amounts to: don’t use repeating-linear-gradient. Just use linear-gradient, set a background-size and let it repeat. Indeed, that seems to do the trick. The trouble with this is… how big do you make the background-size? If the stripes are vertical or horizontal, it’s fairly easy to smudge something. But if the stripes are at an angle… calculating the perfect width×height is tricky. I’d guess it’s related to the Pythagorean theorem, but I’m out of my depth there.

So, what do you do?

Use this nice little generator tool thing:

It does whatever fancy math necessary to get it right. You can see the unminified JavaScript here. Search for / GET BACKGROUND SIZE / to see all the math going on. Whatever it’s doing there, the stripes come out perfectly.

Kind of a shame repeating-linear-gradient doesn’t have better visual output as that’s so much easier to reason about, but hey, you gotta do what you gotta do.


The post No-Jank CSS Stripes appeared first on CSS-Tricks.

You can support CSS-Tricks by being an MVP Supporter.


from CSS-Tricks https://ift.tt/39EiGk6
via IFTTT

SEO Forecasting in Google Sheets

Posted by Tom.Capper

Way back in 2015, I published an article giving away a free, simple, forecasting tool, and talking through use cases for forecasting in SEO. It was a quick, effective way to see if a change to your site traffic is some kind of seasonality you can ignore, something to celebrate, or a worrying sign of traffic loss.

In short: you could enter in a series of data, and it would plot it out on a graph like the image above.

Five years later, I still get people — from former colleagues to complete strangers — asking me about this tool, and more often than not, I’m asked for a version that works directly in spreadsheets.

I find this easy to sympathize with: a spreadsheet is more flexible, easier to debug, easier to expand upon, easier to maintain, and a format that people are very familiar with.

The tradeoff when optimizing for those things is, although I’ve improved on that tool from a few years ago, I’ve still had to keep things manageable in the famously fickle programming environment that is Excel/Google Sheets. That means the template shared in this post uses a simpler, slightly less performant model than some tools with external code execution (e.g. Forecast Forge).

In this post, I’m going to give away a free template, show you how it works and how to use it, and then show you how to build your own (better?) version. (If you need a refresher on when to use forecasting in general, and concepts like confidence intervals, refer to the original article linked above.).

Types of SEO forecast

There is one thing I want to expand on before we get into the spreadsheet stuff: the different types of SEO forecast.

Broadly, I think you can put SEO forecasts into three groups:

  1. “I’m feeling optimistic — add 20% to this year” or similar flat changes to existing figures. More complex versions might only add 20% to certain groups of pages or keywords. I think a lot of agencies use this kind of forecast in pitches, and it comes down to drawing on experience.
  2. Keyword/CTR models, when you estimate a ranking change (or sweeping set of ranking changes), then extrapolate the resulting change in traffic from search volume and CTR data (you can see a similar methodology here). Again, more complex versions might have some basis for the ranking change (e.g. “What if we swapped places with competitor A in every keyword of group X where they currently outrank us?”).
  3. Statistical forecast based on historical data, when you extrapolate from previous trends and seasonality to see what would happen if everything remained constant (same level of marketing activity by you and competitors, etc.).

Type two has its merits, but if you compare the likes of Ahrefs/SEMRush/Sistrix data to your own analytics, you’ll see how hard this is to generalize. As an aside, I don’t think type one is as ridiculous as it looks, but it’s not something I’ll be exploring any further in this post. In any case, the template in this post fits into type three.

What makes this an SEO forecast?

Why, nothing at all. One thing you’ll notice about my description of type three above is that it doesn’t mention anything SEO-specific. It could equally apply to direct traffic, for example. That said, there are a couple of reasons I’m suggesting this specifically as an SEO forecast:

  • We’re on the Moz Blog and I’m an SEO consultant.
  • There are better methodologies available for a lot of other channels.

I mentioned that type two above is very challenging, and this is because of the highly non-deterministic nature of SEO and the generally poor quality of detailed data in Search Console and other SEO-specific platforms. In addition, to get an accurate idea of seasonality, you’d need to have been warehousing your Search Console data for at least a couple of years.

For many other channels, high quality, detailed historic data does exist, and relationships are far more predictable, allowing more granular forecasts. For example, for paid search, the Forecast Forge tool I mentioned above builds in factors like keyword-level conversion data and cost-per-click based on your historical data, in a way that would be wildly impractical for SEO.

That said, we can still combine multiple types of forecast in the template below. For example, rather than forecasting the traffic of your site as a whole, you might forecast subfolders separately, or brand/non-brand separately, and you might then apply percentage growth to certain areas or build in anticipated ranking changes. But, we’re getting ahead of ourselves…

How to use the template

FREE TEMPLATE

The first thing you’ll need to do is make a copy (under the “File” menu in the top left, but automatic with the link I’ve included). This means you can enter your own data and play around to your heart’s content, and you can always come back and get a fresh copy later if you need one.

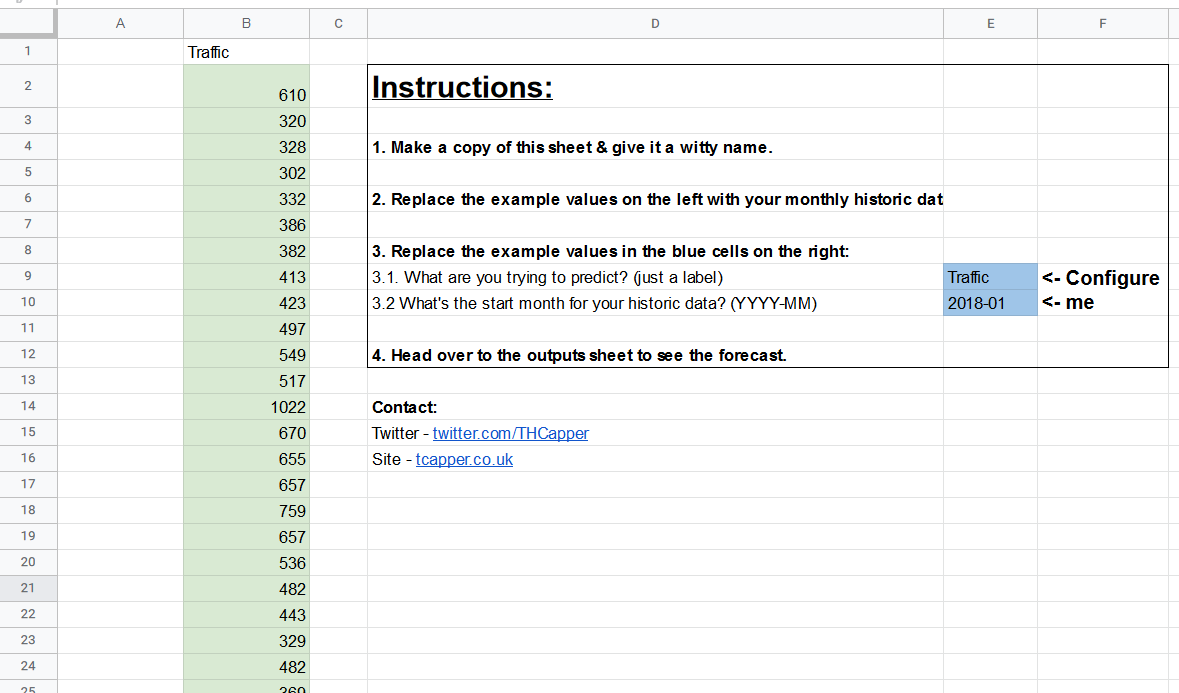
Then, on the first tab, you’ll notice some cells have a green or blue highlight:

You should only be changing values in the colored cells.

The blue cells in column E are basically to make sure everything ends up correctly labelled in the output. So, for example, if you’re pasting session data, or click data, or revenue data, you can set that label. Similarly, if you enter a start month of 2018-01 and 36 months of historic data, the forecast output will begin in January 2021.

On that note, it needs to be monthly data — that’s one of the tradeoffs for simplicity I mentioned earlier. You can paste up to a decade of historic monthly data into column B, starting at cell B2, but there are a couple of things you need to be careful of:

  • You need at least 24 months of data for the model to have a good idea of seasonality. (If there’s only one January in your historic data, and it was a traffic spike, how am I supposed to know if it was a one-off thing, or an annual thing?)
  • You need complete months. So if it’s March 25, 2021 when you’re reading this, the last month of data you should include is February 2021.

Make sure you also delete any leftovers of my example data in column B.

Outputs

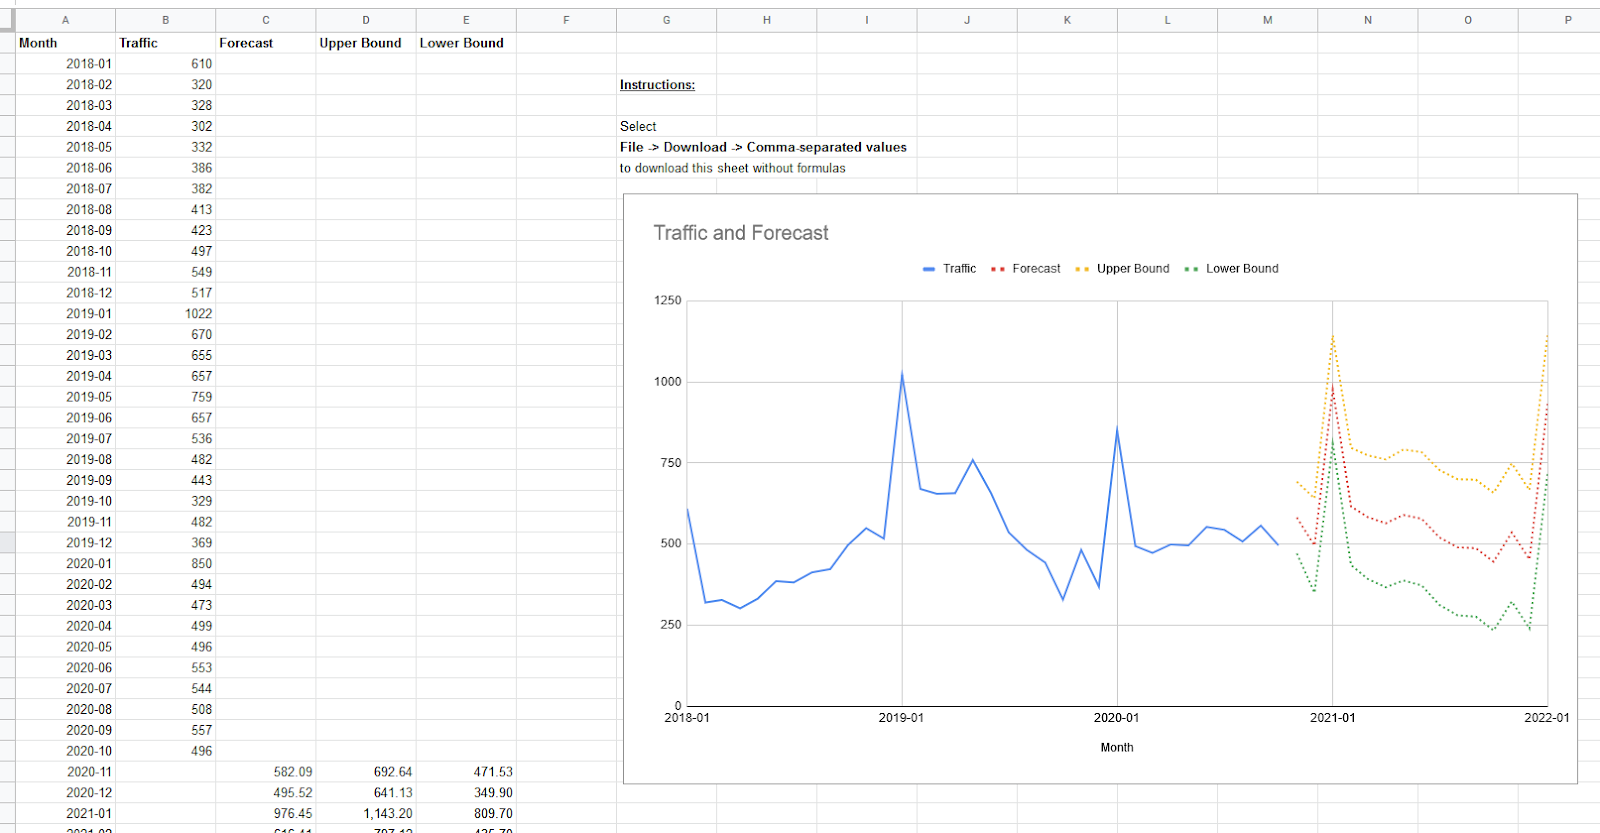
Once you’ve done that, you can head over to the “Outputs” tab, where you’ll see something like this:

Column C is probably the one you’re interested in. Keep in mind that it’s full of formulas here, but you can copy and paste as values into another sheet, or just go to File > Download > Comma-separated values to get the raw data.

You’ll notice I’m only showing 15 months of forecast in that graph by default, and I’d recommend you do the same. As I mentioned above, the implicit assumption of a forecast is that historical context carries over, unless you explicitly include changed scenarios like COVID lockdowns into your model (more on that in a moment!). The chance of this assumption holding two or three years into the future is low, so even though I’ve provided forecast values further into the future, you should keep that in mind.

The upper and lower bounds shown are 95% confidence intervals — again, you can recap on what that means in my previous post if you so wish.

Advanced use cases

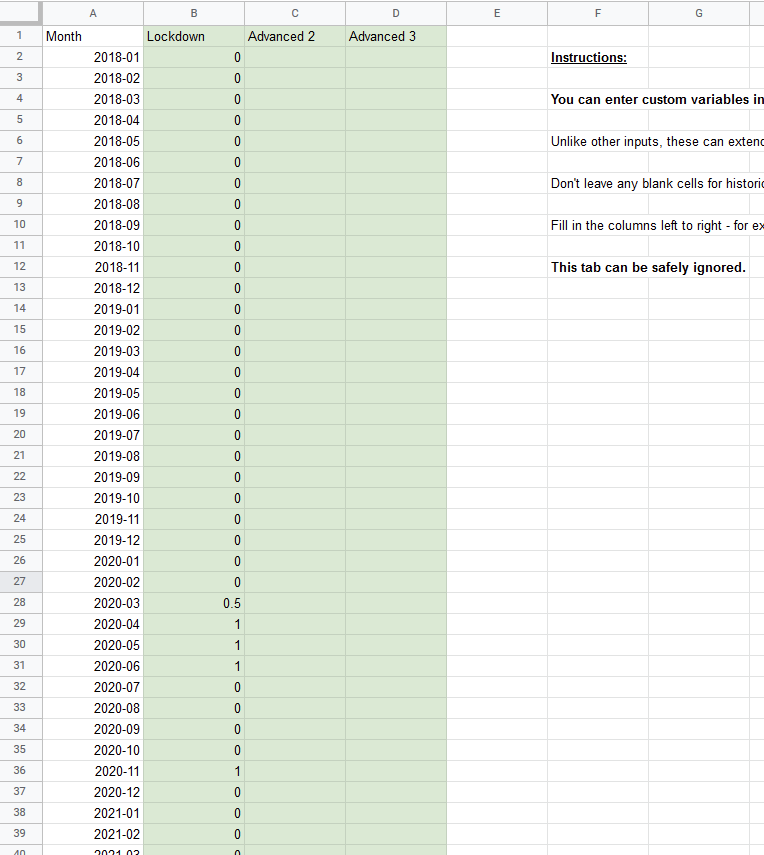
You may by now have noticed the “Advanced” tab:

Although I said I wanted to keep this simple, I felt that given everything that happened in 2020, many people would need to incorporate major external factors into their model.

In the example above, I’ve filled in column B with a variable for whether or not the UK was under COVID lockdown. I’ve used “0.5” to represent that we entered lockdown halfway through March.

You can probably make a better go of this for the relevant factors for your business, but there are a few important things to keep in mind with this tab:

  • It’s fine to leave it completely untouched if you don’t want to add these extra variables.
  • Go from left to right — it’s fine to leave column C blank if you’re using column B, but it’s not fine to leave B blank if you’re using C.
  • If you’re using a “dummy” variable (e.g. “1” for something being active), you need to make sure you fill in the 0s in other cells for at least the period of your historic data.
  • You can enter future values — for example, if you predict a COVID lockdown in March 2021 (you bastard!), you can enter something in that cell so it’s incorporated into the forecast.
  • If you don’t enter future values, the model will predict based on this number being zero in the future. So if you’ve entered “branded PPC active” as a dummy variable for historic data, and then left it blank for future periods, the model will assume you have branded PPC turned off in the future.
  • Adding too much data here for too few historic periods will result in something called “overfit” — I don’t want to get into detail on this, which is why this tab is called “Advanced”, but try not to get carried away.

Here’s some example use cases of this tab for you to consider:

  • Enter whether branded PPC was active (0 or 1)
  • Enter whether you’re running TV ads or not
  • Enter COVID lockdowns
  • Enter algorithm updates that were significant to your business (one column per update)

Why are my estimates different to your old tool? Is one of them wrong?

There’s two major differences in method between this template and my old tool:

  • The old tool used Google’s Causal Impact library, the new template uses an Ordinary Least Squares regression.
  • The old tool captured non-linear trends by using time period squared as a predictive variable (e.g. month 1 = 1, month 2 = 4, month 3 = 9, etc.) and trying to fit the traffic curve to that curve. This is called a quadratic regression. The new tool captures non-linear trends by fitting each time period as a multiple of the previous time period (e.g. month 1 = X * month 2 where X can be any value). This is called an AR(1) model.

If you’re seeing a significant difference in the forecast values between the two, it almost certainly comes down to the second reason, and although it adds a little complexity, in the vast majority of cases the new technique is more realistic and flexible.

It’s also far less likely to predict zero or negative traffic in the case of a severe downwards trend, which is nice.

How does it work?

There’s a hidden tab in the template where you can take a peek, but the short version is the “LINEST()” spreadsheet formula.

The inputs I’m using are:

  • Dependent variables
    • Whatever you put as column B in the inputs tab (like traffic)
  • Independent variables
    • Linear passing of time
    • Previous period’s traffic
    • Dummy variables for 11 months (12th month is represented by the other 11 variables all being 0)
    • Up to three “advanced” variables

The formula then gives a series of “coefficients” as outputs, which can be multiplied with values and added together to form a prediction like:

  • “Time period 10” traffic = Intercept + (Time Coefficient * 10) + (Previous Period Coefficient * Period 9 traffic)

You can see in that hidden sheet I’ve labelled and color-coded a lot of the outputs from the Linest formula, which may help you to get started if you want to play around with it yourself.

Potential extensions

If you do want to play around with this yourself, here are some areas I personally have in mind for further expansion that you might find interesting:

  • Daily data instead of monthly, with weekly seasonality (e.g. dip every Sunday)
  • Built-in growth targets (e.g. enter 20% growth by end of 2021)

Richard Fergie, whose Forecast Forge tool I mentioned a couple of times above, also provided some great suggestions for improving forecast accuracy with fairly limited extra complexity:

  • Smooth data and avoid negative predictions in extreme cases by taking the log() of inputs, and providing an exponent of outputs (smoothing data may or may not be a good thing depending on your perspective!).
  • Regress on the previous 12 months, instead of using the previous 1 month + seasonality (this requires 3 years’ minimum historical data)

I may or may not include some or all of the above myself over time, but if so I’ll make sure I use the same link and make a note of it in the spreadsheet, so this article always links to the most up-to-date version.

If you’ve made it this far, what would you like to see? Let me know in the comments!


Sign up for The Moz Top 10, a semimonthly mailer updating you on the top ten hottest pieces of SEO news, tips, and rad links uncovered by the Moz team. Think of it as your exclusive digest of stuff you don't have time to hunt down but want to read!


from The Moz Blog https://ift.tt/3aso9d0
via IFTTT

Passkeys: What the Heck and Why?

These things called  passkeys  sure are making the rounds these days. They were a main attraction at  W3C TPAC 2022 , gained support in  Saf...